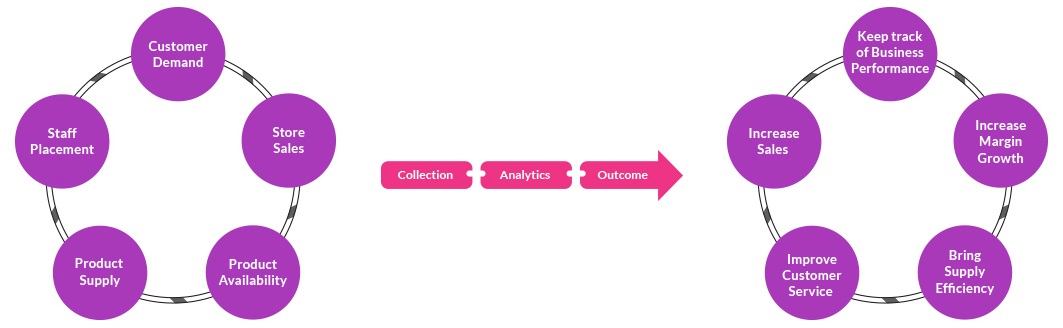
The point is that the business is in the right direction, retail key metrics takes a big part to generate actions on looking the calculated measures of Footfall, Conversion, UPT, ATV, ASP & etc.
Business can see, what are the areas need immediate attention, what is the reason of decline, what is and what should analysis to improve the Sales performance.
Often, retailer revenues can be predominantly related to sales registered for various item categories rather than the sales of particular brands. Consequently, the results of % Sales by product category are vital for the effective management of one product category and ultimately for the overall revenue.
To improve in category turnover and growth business need to identify what is the reason of product category growth or degrowth.
Demand based replenishment, what product location have minimum quantity.
How the business fill rate is performing
What Products are going out of stock
Status of GIT, GRC etc..
Store location city, Area, Customer demography
Identify the heath of each location is necessary to have location wise analysis.
Behavior of common cluster location.
What contribution of option in each division is performing based on low, medium, high.
What store and option are high sellers, average seller or low sellers.
What article option are more or less selling.
What option high or low in demand base on season.
Potential variance of sales in the coming days due to seasons. festivals. essentially arriving at an actual sales for each SKU in time to come.
Identify the top products as per their sales pattern and view the daily perfor-mance.
Accordingly the days of supply store gets updated on what fast moving products stock cover they have.
How the product at article level is performing.
What product are high impact on season start, in season or ending the season.
What inventory suppose to be there in season start.
What are the store operation area need to be prepared.
Calculate Your Customer Retention Rate
Understanding Your Customers' Needs.
Create Customer Segmentation Analysis Report
Measure Your Customer Loyalty based on weekly, monthly & quarterly visits.
Monitor Customer Reactions with Promotions and Product Recommendations
The focus on this analysis is differentiate bill segment.
Identify what location have similar segment.
What impact come on bill size promotion.
What & how to reduce or increase segment of bills.
What are top promotion in terms of liquidation.
Impact of promotion on group article sales.
Margin analysis on promo start and end.
Intelligence to create effective promotion base on history.
What drive customer to purchase on particular amount on sale.
What Month, Season, festival etc drive customer purchase behavior.
What are the common customer of the same behavior.
Major factor in bring customer spending optimize.
The focus on this analysis is differentiate bill segment.
Identify what location have similar segment.
What impact come on bill size promotion.
What & how to reduce or increase segment of bills.
Impact of age, gender, sex, religion etc on location cluster.
Income and spending group of individual location.
High, medium & Low cluster on deferent patterns.
Forecasting of location profitability
Data is everything, when looking into data everyone have their different prospective related to their skill and understanding but the data speak beyond. Fabi Analytics dig in data to see all kind of information.
Sign up for Free Demo